

Processing Summary
Overview
The Processing Summary screen shows the progress of each ingestion through Fynapse: how many records every processing stage passed, deferred or failed. To browse, go to Operations > Processing Summary.
The screen has two views:
- The Classic view shows the processing of Business Events into Journals in fixed columns, one row per ingestion.
- The Pipeline view follows each ingestion through the stages it actually passes, Flows included, and opens each ingestion on its own page.
Actions on the Screen
You can perform the following actions in both views:
- To switch views, click Classic or Pipeline in the toolbar above the grid. Fynapse remembers the view you last chose in your browser.
- To choose which ingestions are shown, set From. The grid lists the ingestions that started on or after this date and time. By default, From is set to midnight seven days ago.
- To restore the default From, click Reset.
- To load the latest counts at once, click Refresh. The screen also refreshes automatically every 30 seconds.
If Fynapse cannot reach the server, a warning reads “It appears that there’s a connectivity problem”, and the grid keeps the rows from the last successful refresh.
Classic View
The classic view lists one row per ingestion, newest first, 100 rows per page.
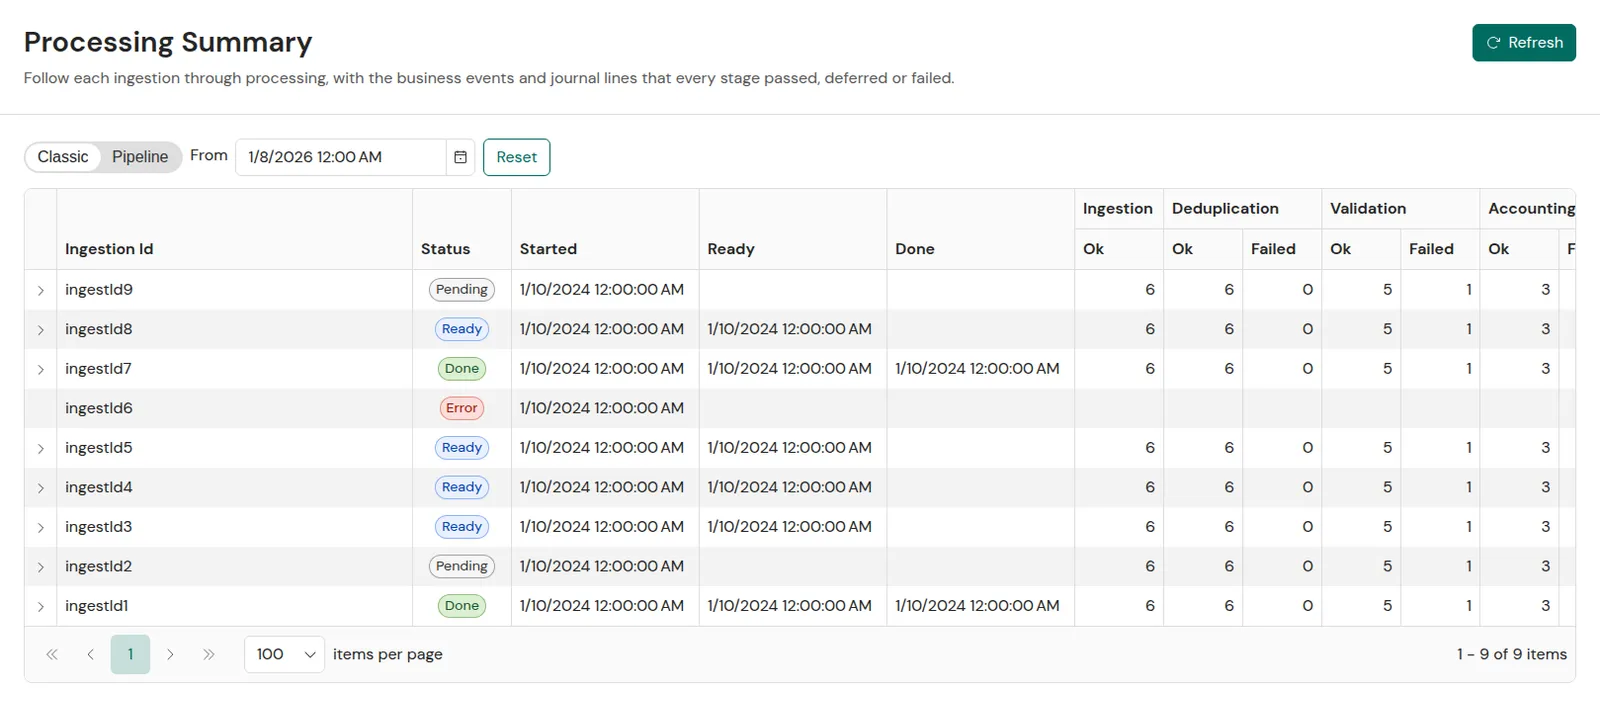
The grid has the following columns:
- Ingestion Id - the ID of the data file which was ingested into Fynapse. (For more details about ingesting data, refer to Data Input File Ingestion.)
- Status - the status of the processing of the data from the ingestion file
- Done - processing completed, all generated Journals have been posted
- Ready - after the first run of the data through the system, all data are either errored, posted or unposted
- Pending - the file was uploaded and processing is in progress
- Error - the file did not load on the File Ingestion screen
- Started - the timestamp of upload of the file
- Ready - the time when the first run of data through the system was completed; subsequent run throughs will not change the timestamp, only when the data reach the Done status will a new timestamp be assigned in the Done column
- Done - the time when processing was fully completed, i.e. all records have been processed and posted, all failed records have been successfully reprocessed
- Ingestion - the process of ingesting Business Events into Fynapse
- Ok - the total number of Business Events ingested from the ingestion file
- Deduplication - the process of identifying duplicated Business Events, i.e. Business Events which already exist in Fynapse
- Ok - the number of Business Events that are new Business Events, not duplicates, from the total number of ingested Business Events
- Failed - the number of deduplicated Business Events from the total number of ingested Business Events
- Validation - the process of validating ingested Business Events against defined validation rules
- Ok - the number of Business Events which comply with validation rules from the Business Events which were identified as new during the deduplication process
- Failed - the number of Business Events which failed to comply with validation rules and were errored from the Business Events which were identified as new during the deduplication process
- Accounting Engine - the processing of Business Events in accordance with setup accounting rules
- Ok - the number of Business Events processed by the Accounting Engine from the Business Events which passed the validation process
- Failed - the number of Business Events that failed processing by the Accounting Engine from the Business Events which passed the validation process
- Generated Journal Lines - the number of Journal Lines generated by the Accounting Engine from the Business Events ingested in the ingestion file
- Validation - the process of validating generated Journal Lines against defined validation rules
- Ok - the number of Journal Lines which comply with validation rules from the Journal Lines generated by the Accounting Engine
- Failed - the number of Journal Lines which failed to comply with validation rules and were errored from the Journal Lines generated by the Accounting Engine
- Journal Processing - systemic validations of generated Journal Lines
- Ok - generated Journal Lines are ready to be posted
- Future - generated Journal Lines with future Posting Date
- Failed - generated Journal Lines which failed systemic validations and awaiting reprocessing
- Stored - Journal Lines available for extraction
- Ok - the number of posted Journal Lines stored in the Journals Entity
- Future - the number of future dated Journal Lines stored in the Unposted Journals Entity. When they reach the maturity date, they will be posted and stored in the Journals Entity.
The classic view lists ingestions of Business Events and Journal input, and ingestions whose Flows write Business Events or Journal input. Reference data ingestions, and ingestions whose Flows write neither, appear only in the Pipeline view.
A count that is too wide for its column ends in an ellipsis; widen the column to see the whole number. You can resize every column.
Subledger Statistics
To see the Journal Lines of an ingestion per Core Date and Subledger Node, click the arrow at the start of its row. The Subledger statistics section opens under the row. A refresh keeps it open.
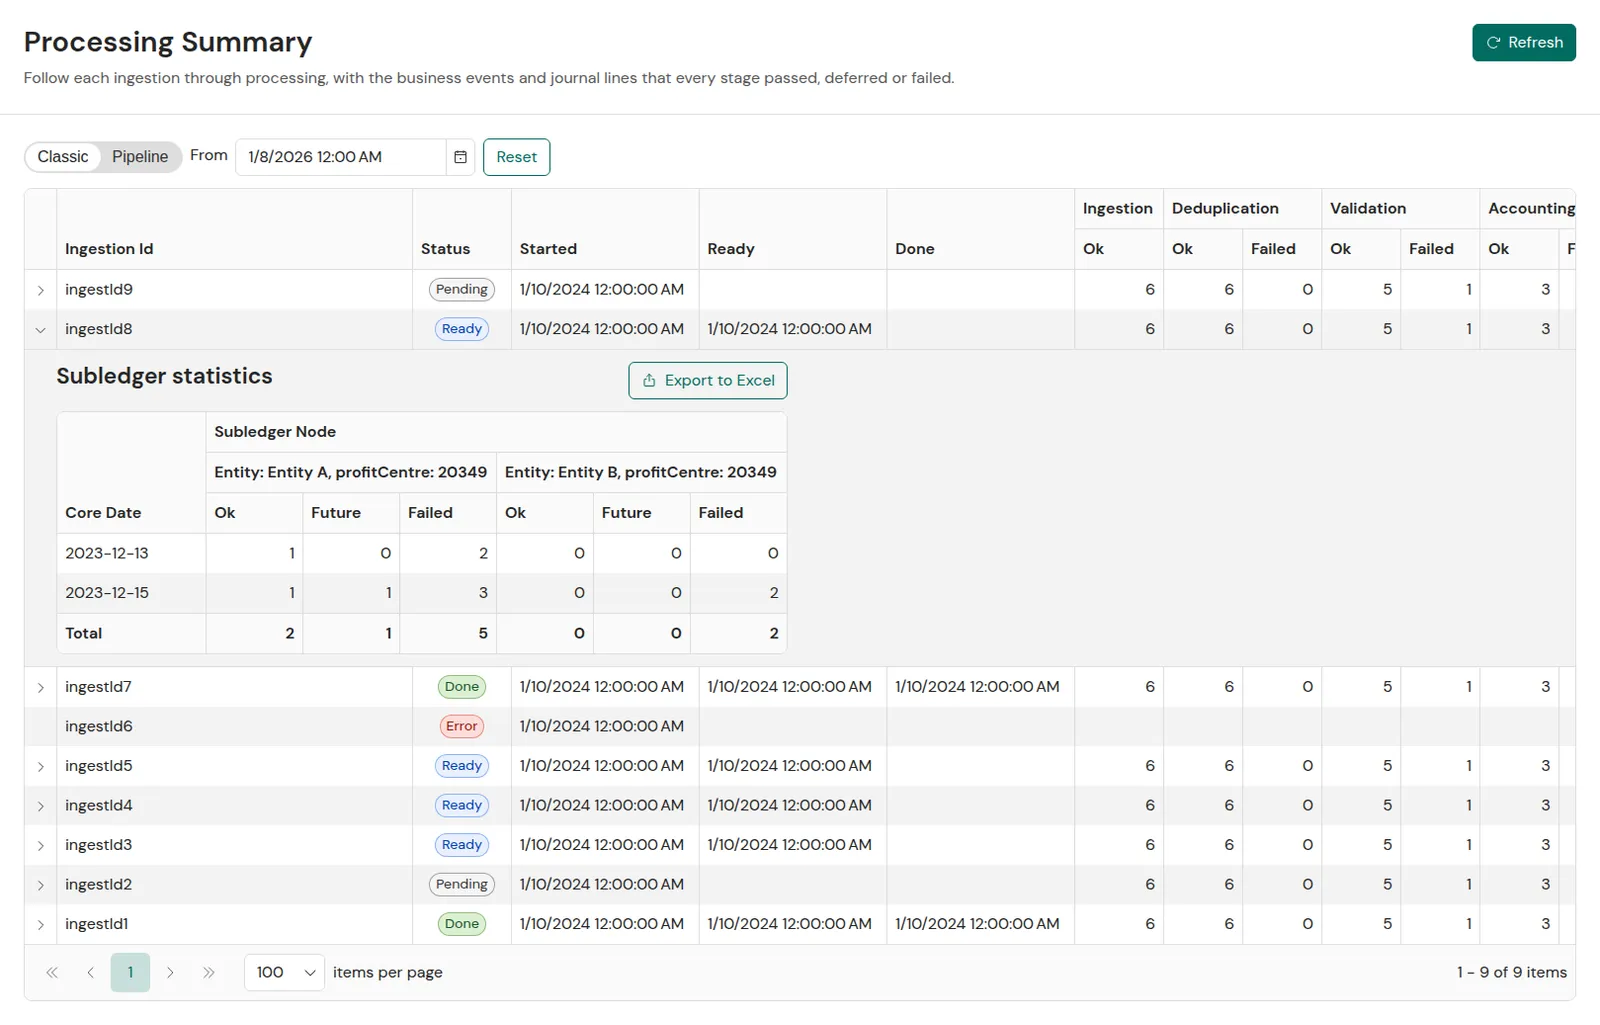
The section contains a grid with one row per Core Date and a column group per Subledger Node. The Subledger Nodes are named by the labels of the Journal Line Definition fields. Each Subledger Node has the following columns:
- Ok - the number of posted Journal Lines
- Future - the number of Journal Lines with a future Posting Date
- Failed - the number of Journal Lines that failed
The last row, Total, sums each column.
To download the grid as an Excel workbook, click Export to Excel. The workbook has the same column groups and ends with the Total row. Export to Excel is available only if your role allows you to export the Processing Summary statistics.
Pipeline View
The Pipeline view follows each ingestion through the stages it actually passes, including the Flows that read its records and everything those Flows wrote. It lists one row per ingestion, newest first, 100 rows per page.
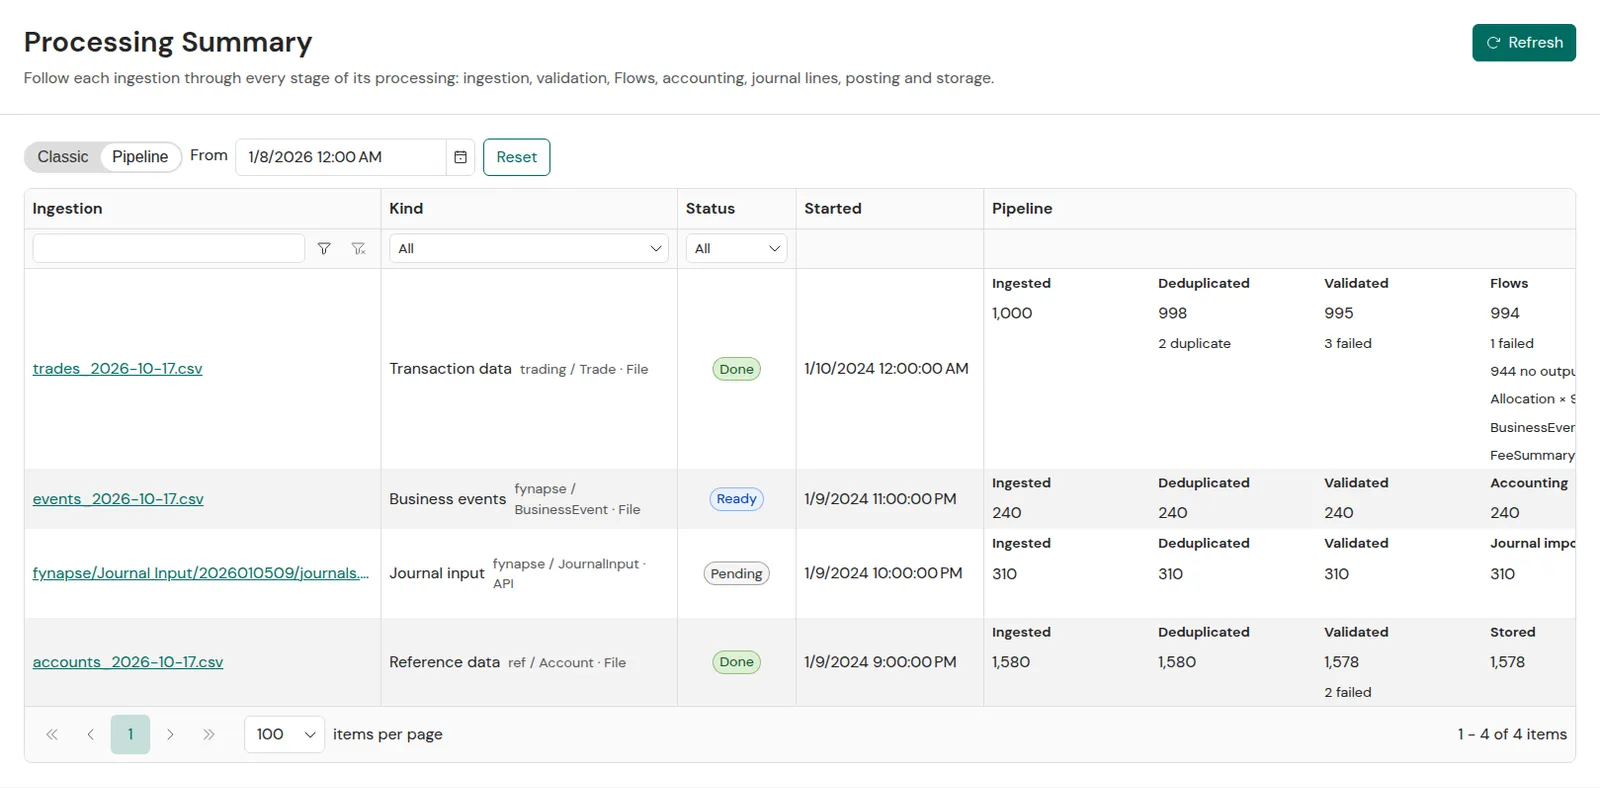
The grid has the following columns:
- Ingestion - the ID of the ingestion. Click it to open the ingestion’s Details screen.
- Kind - what the ingestion contains, by its Entity: Business events, Journal input, Reference data or Transaction data. The input Entity and the source follow: File, API, or Extract for the output of an extract.
- Status - the statuses of the classic view. An ingestion where Flows write no Business Events or Journal input is Done once everything the Flows wrote is stored.
- Started - the time when the ingestion started.
- Pipeline - one cell per stage the ingestion passes. Each cell shows the number of records that passed the stage and, under it, the records that did not: duplicates, failures, records a Flow produced no output for, and unposted Journal Lines. A stage that has not started yet reads not started.
To narrow the rows, use the filter row under the column headers: filter Ingestion by text, and Kind and Status by a value from the list.
Which Ingestions Appear
The Pipeline view lists ingestions of every kind, including reference data, and ingestions read by Flows that write no Business Events or Journal input, which the classic view does not list. An ingestion appears when all of the following are true:
- It started on or after From, and after Fynapse started recording pipeline data. For more information, see Notes Above the Grid.
- Fynapse has received its records from a file, the API or an extract.
- For an Entity that Flows can read, the Flows have counted its records, or none of its records can reach the Flows because each one was a duplicate or failed validation. Until then, Fynapse cannot tell whether a Flow processes the ingestion.
The list is updated about once a minute, so a new ingestion can take up to a minute to appear. An ingestion shows the Flow stages as soon as a Flow processes any of its records.
Stages
The stages an ingestion passes depend on its kind, and on whether Flows read its records:
An ingestion from an extract starts with Extracted instead of Ingested, and has no Deduplicated stage.
Each stage counts the following records:
Notes Above the Grid
A note appears above the grid in the following situations:
- From is earlier than the time Fynapse started recording pipeline data. The note gives that time: ingestions that started before it are not in the Pipeline view. The classic view lists those that lead to Journals.
- More than 500 ingestions started after From. The grid lists the newest 500; set From closer to now to see the rest.
Ingestion Page
The ingestion page shows one ingestion’s pipeline as a diagram, the Flow runs that read its records, and its Subledger statistics. To open it, click an ingestion in the Pipeline view. To return to the list, click Pipeline above the title.
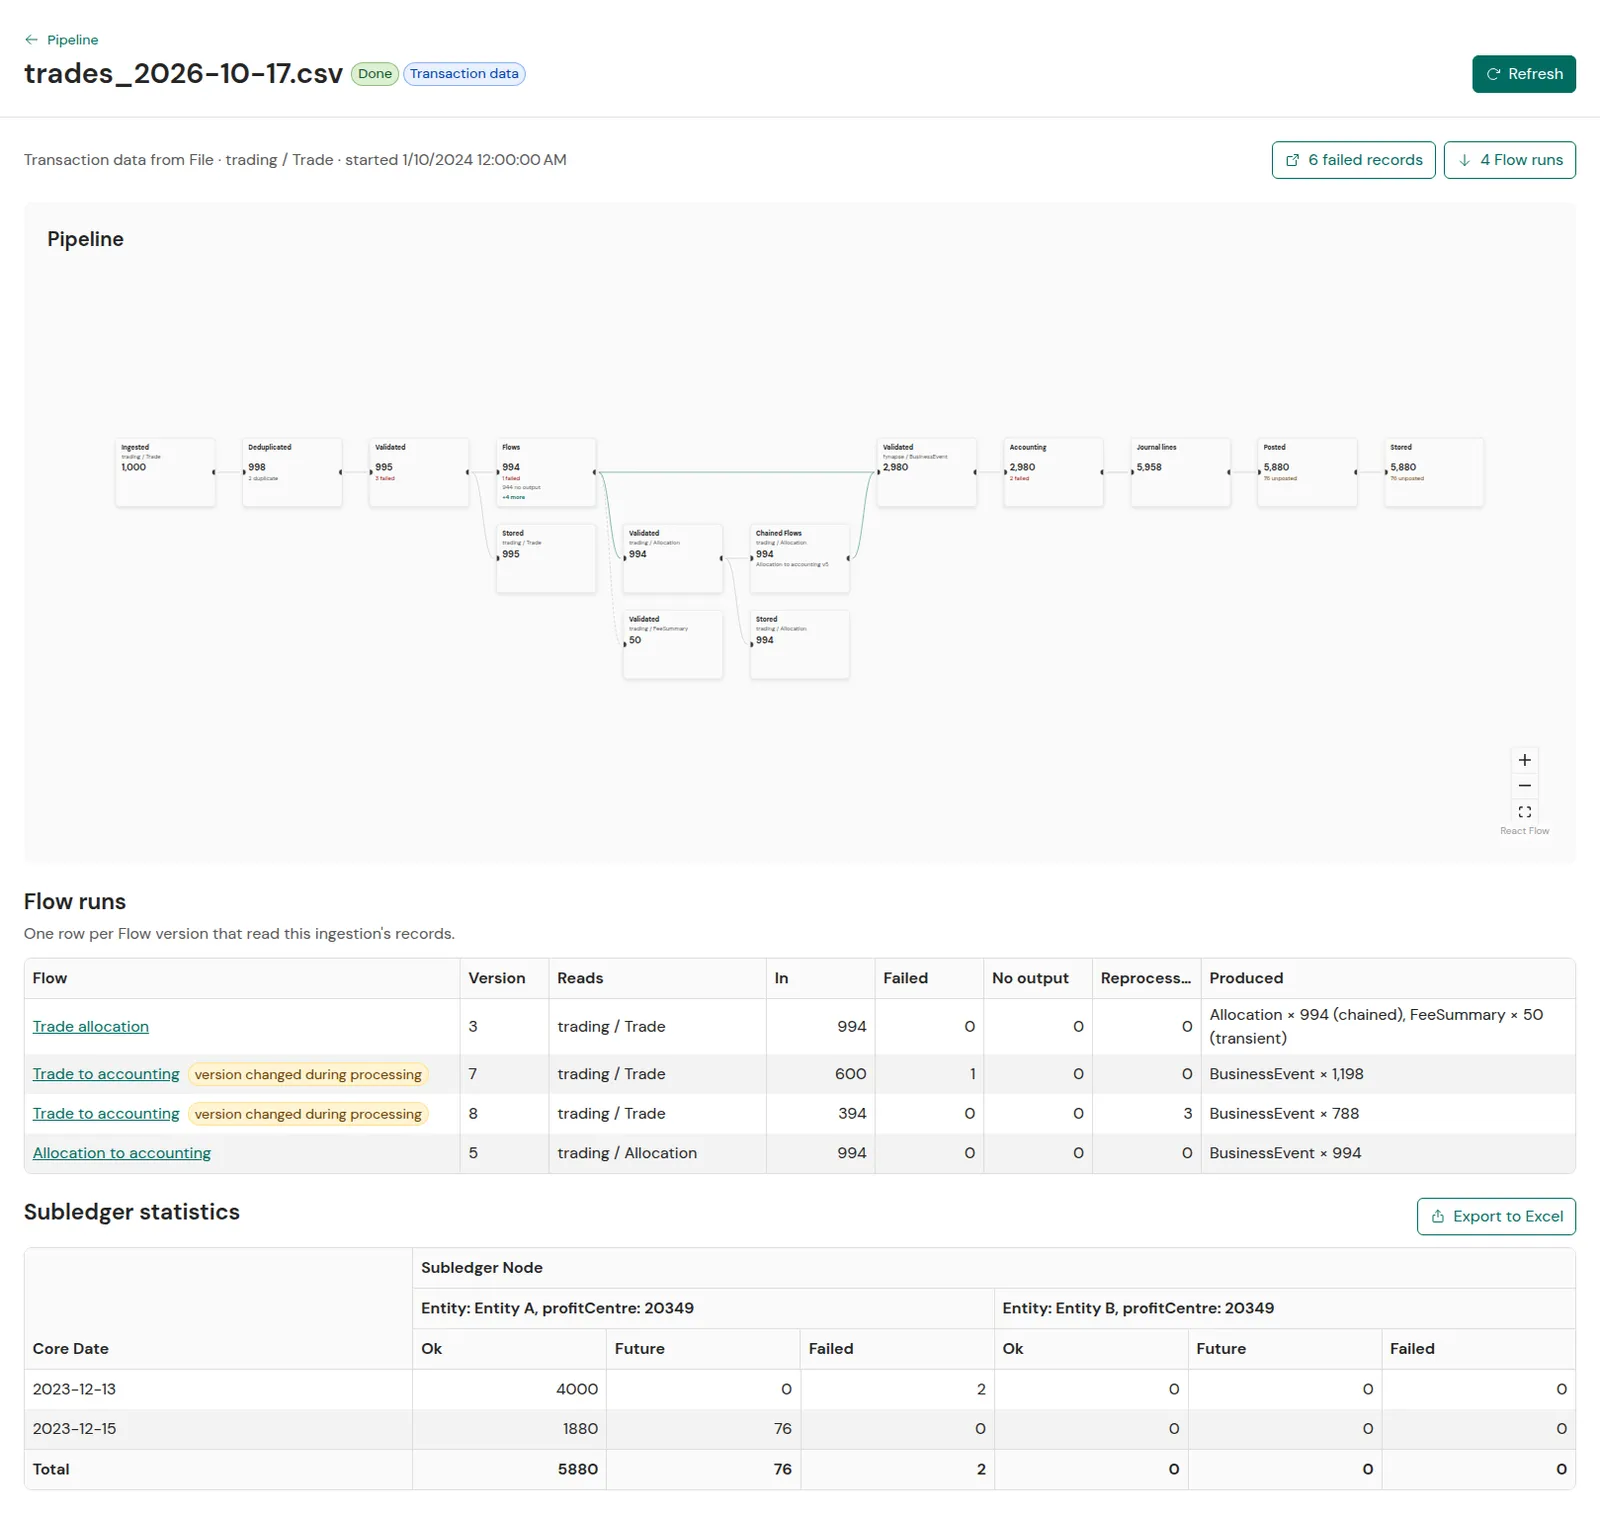
The header shows the ingestion ID, its status and kind, and Refresh. Under the header, a line summarises the ingestion: its kind, source and Entity, and when it started. Next to the summary:
- N failed records opens the Errors screen filtered to the ingestion. If you do not have access to Error Management, the number of failed records is shown as text.
- N Flow runs scrolls the page to the Flow runs table.
Pipeline Diagram
The diagram reads from left to right, with one node per stage and Entity. The main path of the ingestion is the top row; what the Flows wrote branches below it. A node shows the stage, the Entity, the number of records that passed and up to three lines of what did not pass or which Flow versions ran. Failed records are shown in red and unposted Journal Lines in amber. If there are more than three lines, the third line gives the number of the remaining ones: hover over the node, or move the focus to it, to see them all.
The border of a node shows the state of its stage:
- grey dashes - the stage has not started
- moving dashes - the stage is in progress
- a solid line - the stage has processed all the records it received
A highlighted edge leads from the Flows to an Entity they wrote, and a dashed edge leads to a transient Entity, which Fynapse does not store. The diagram fits the page as stages appear, until you pan or zoom. Drag to pan, and use the buttons in the corner to zoom in, zoom out or fit the diagram to the page again.
Flow Runs
The Flow runs table has one row per Flow version that read the ingestion’s records:
- Flow - the name of the Flow. Click it to open the version that ran in the Flow screens, read-only. If you do not have access to Flows, the name is shown as text. The version changed during processing label marks a Flow whose version changed while it processed the ingestion; each version has its own row.
- Version - the version of the Flow
- Reads - the namespace and Entity the Flow read
- In - the number of records the Flow version read
- Failed - the number of records the Flow version failed to process
- No output - the number of records the Flow version processed without writing anything
- Reprocessed - the number of failed records the Flow version processed again after they were resubmitted from Error Management
- Produced - the records the Flow version wrote, per Entity. chained marks an Entity that another Flow reads, and transient marks an Entity that Fynapse does not store.
Subledger Statistics on the Ingestion Page
The ingestion page ends with the same Subledger statistics as an opened row in the classic view, across the full width of the page.
If an ingestion is unknown, started before Fynapse began recording pipeline data, or was processed by Flows before that, its page reads “This ingestion is not in the pipeline view”.